Pen Plotter Art & Algorithms, Part 1
— You can find the source code for this blog series here.
Over the last several months, I’ve been looking for ways to produce physical outputs from my generative code. I’m interested in the idea of developing real, tangible objects that are no longer bound by the generative systems that shaped them. Eventually I plan to experiment with 3D printing, laser cutting, CNC milling, and other ways of realizing my algorithms in the real-world.
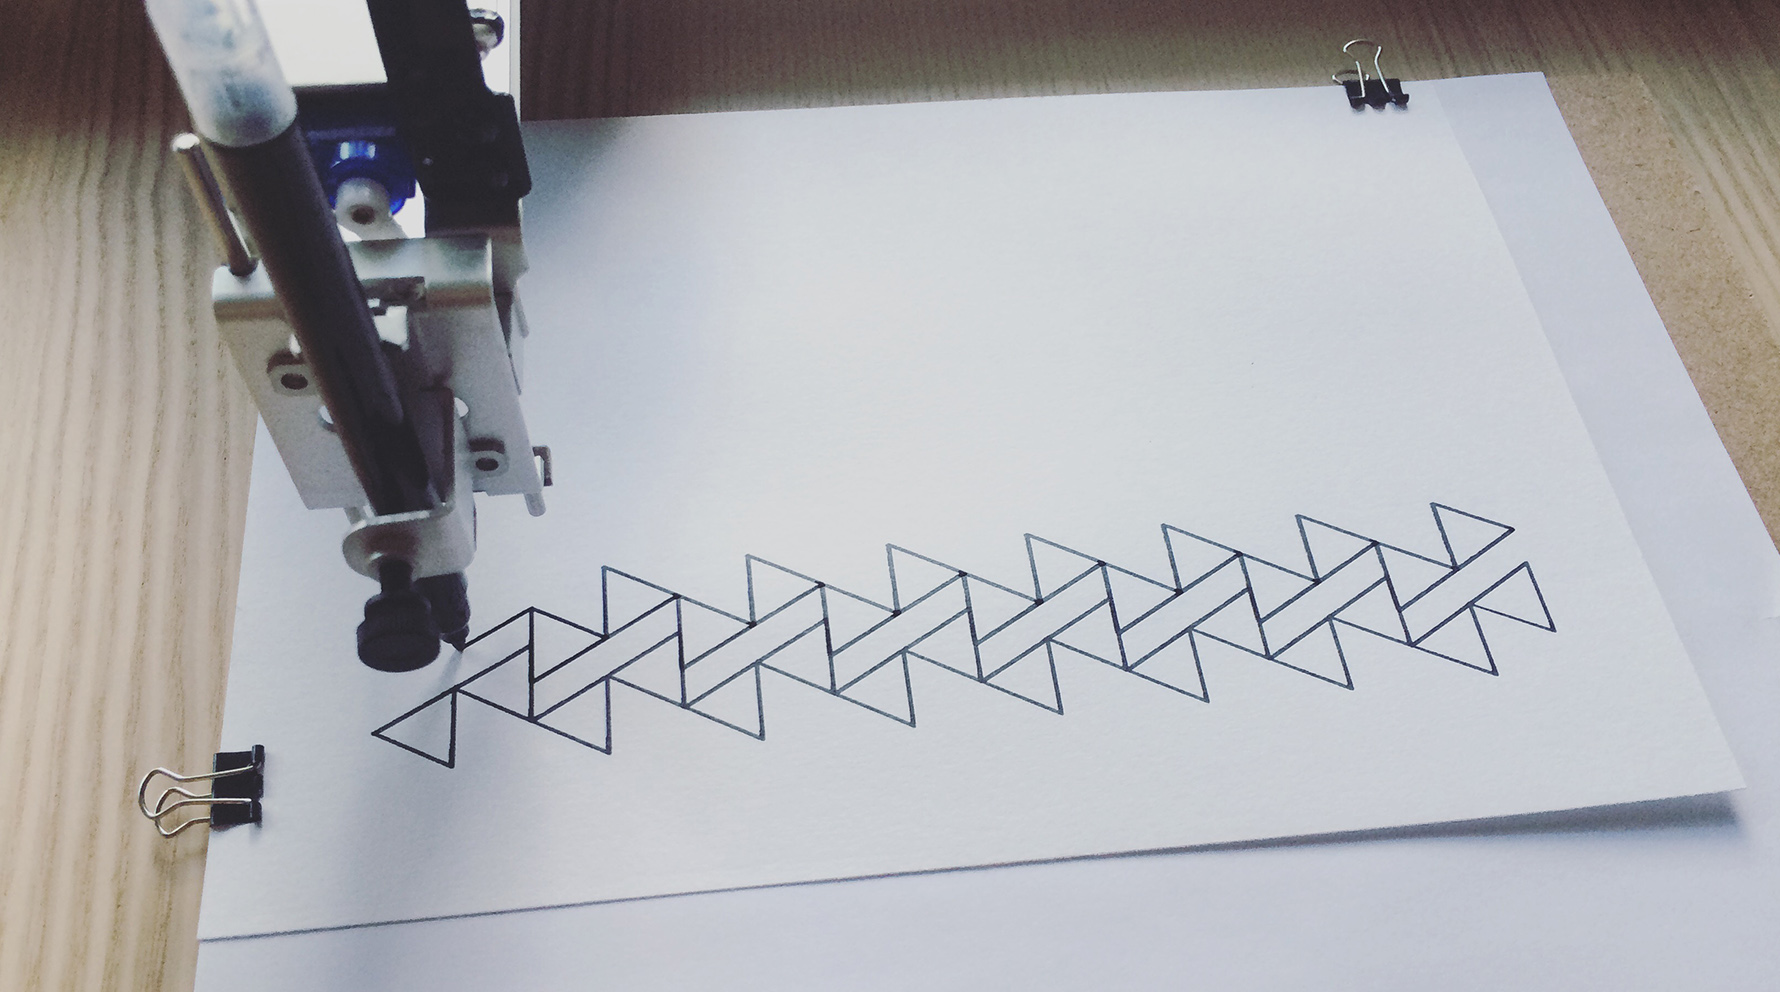
My interest in this began in March 2017, when I purchased my first pen plotter: the AxiDraw V3 by Evil Mad Scientist Laboratories. It’s a fantastic machine, and has opened a whole new world of thinking for me. For those unaware, a pen plotter is a piece of hardware that acts like a robotic arm on which you can attach a regular pen. Software sends commands to the device to raise, reposition, and lower its arm across a 2D surface. With this, the plotter can be programmed to produce intricate and accurate prints with a pen and paper of your choice.
— Early prints, March 2017
Unlike a typical printer, a plotter produces prints with a strangely human quality: occasional imperfections arise as the pen catches an edge or momentarily dries up, and the quality of the ink has the subtle texture and emboss that you normally only see in an original drawing.
🖨 Plotters have been around for a while — if you are just starting off, you might be interested in some of the older but more affordable HP plotters.
Often, these plotters and mechanical devices are controlled by formats like HP-GL or G-code. These formats that specify how the machine should lift, move, and place itself over time. For convenience, AxiDraw handles most of the mechanical operation for you, providing an Inkscape SVG plugin that accepts paths, lines, shapes, and even fills (through hatching).
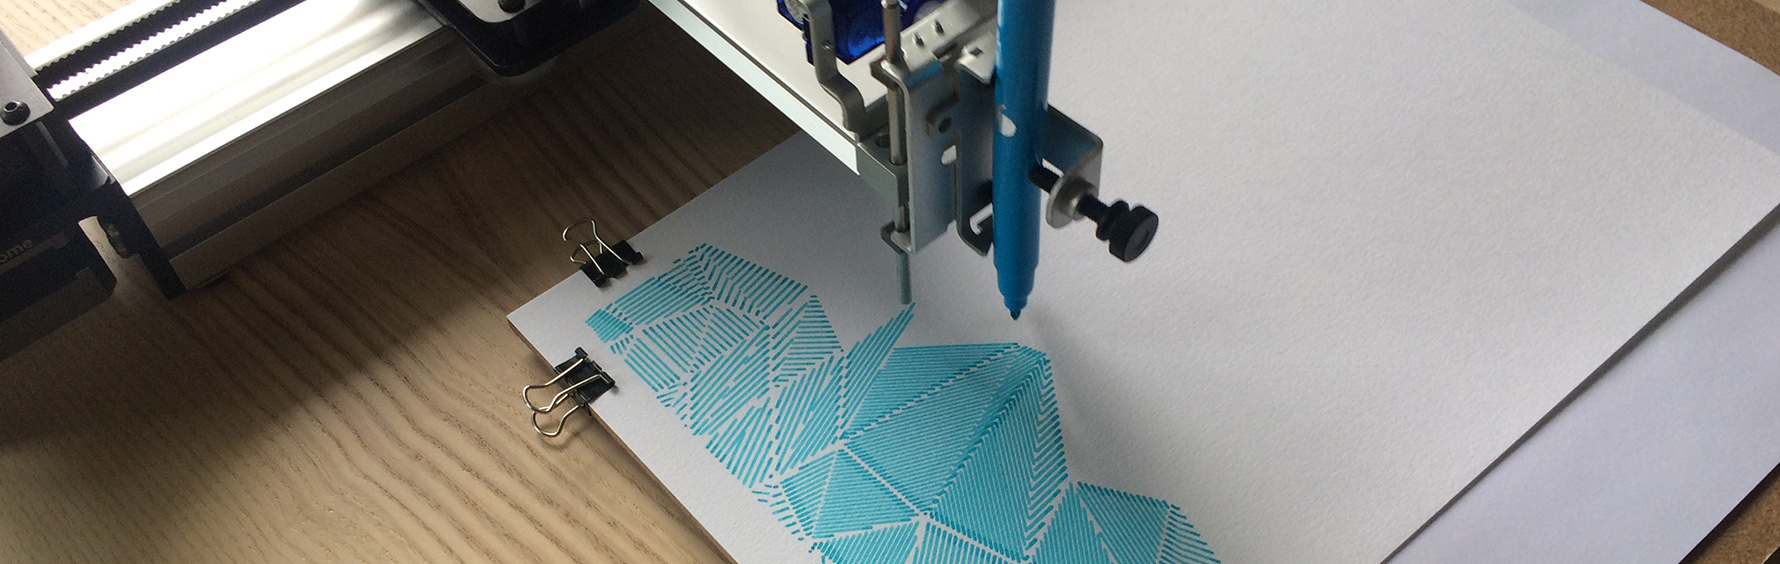
— Tesselations, August 2017
You don’t need to be a programmer to use the AxiDraw pen plotter. You can create SVG files in Adobe Illustrator or find SVGs online to print. However, the machine is very well suited to programmatic and algorithmic line art, as it can run for hours at a time and produce incredibly detailed outputs that would be too tedious to illustrate by hand.
One recent series I developed, Natural Systems, is composed of 4 different algorithms. Each time these algorithms run, they produce different outputs, allowing for an infinite number of unique prints.
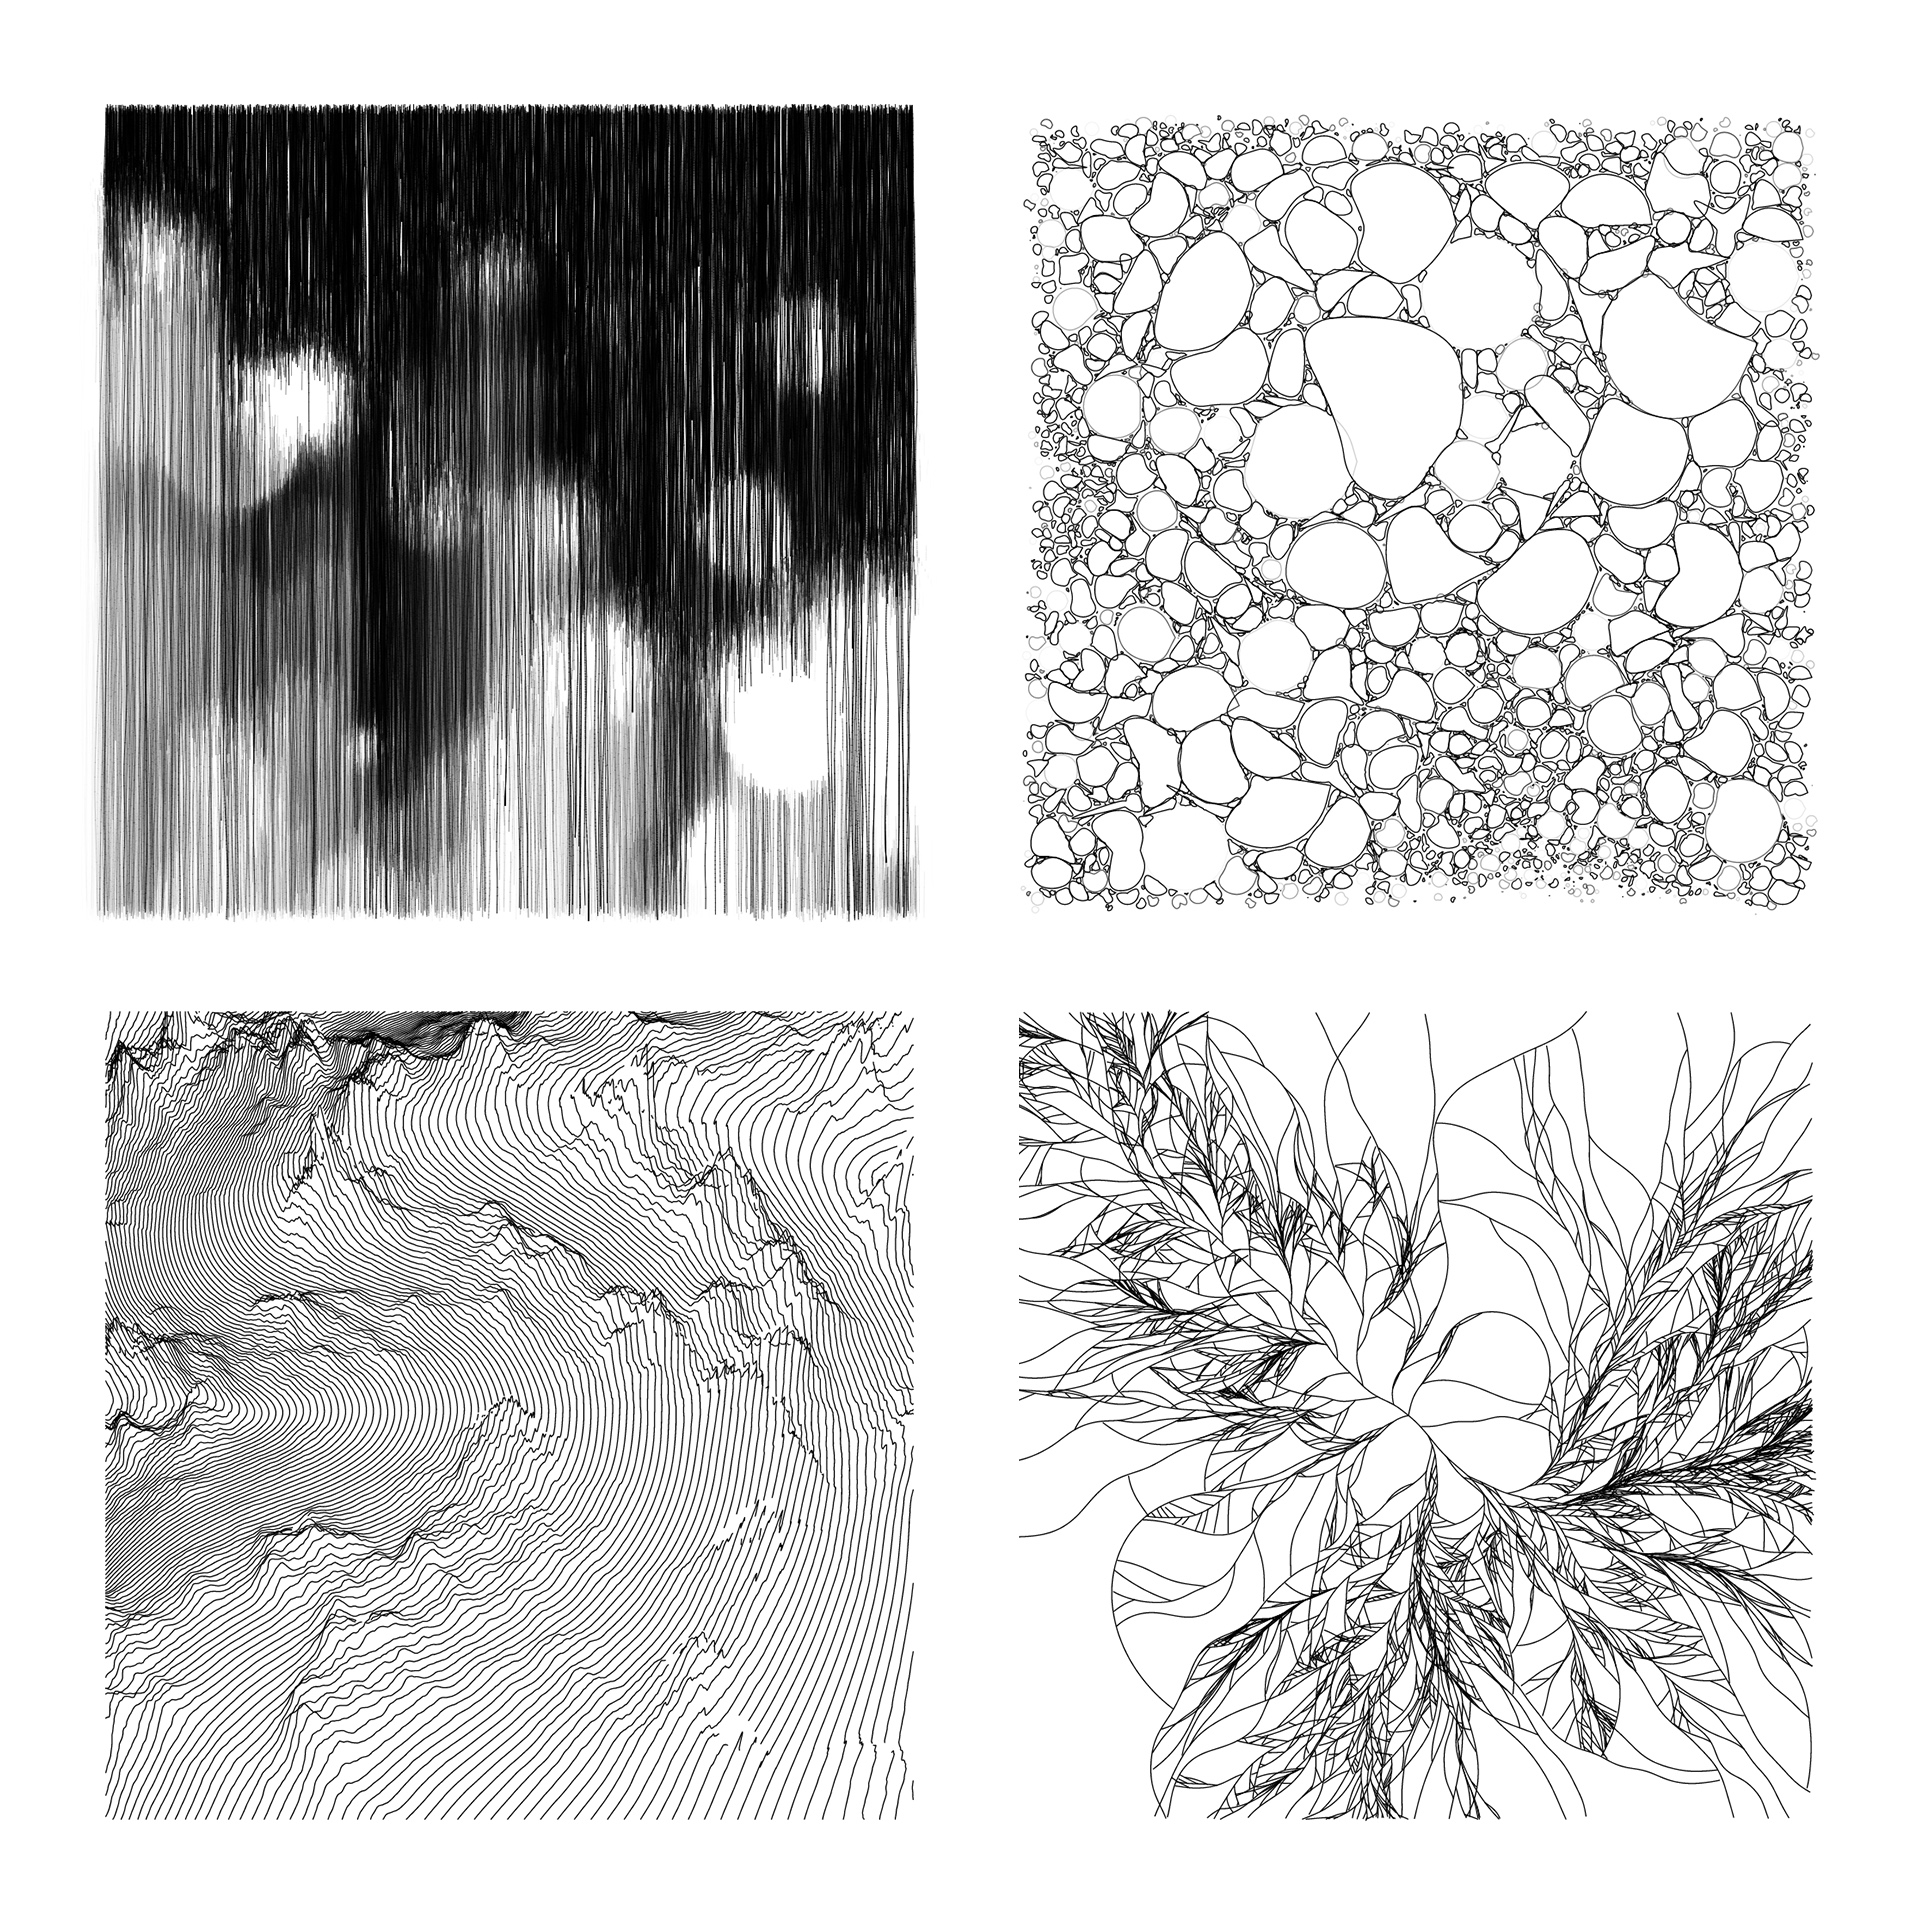
— Natural Systems, November 2017
This isn’t a new concept; Vera Molnár, an early pioneer of computer art, was rendering pen plotter prints in the 1960s!
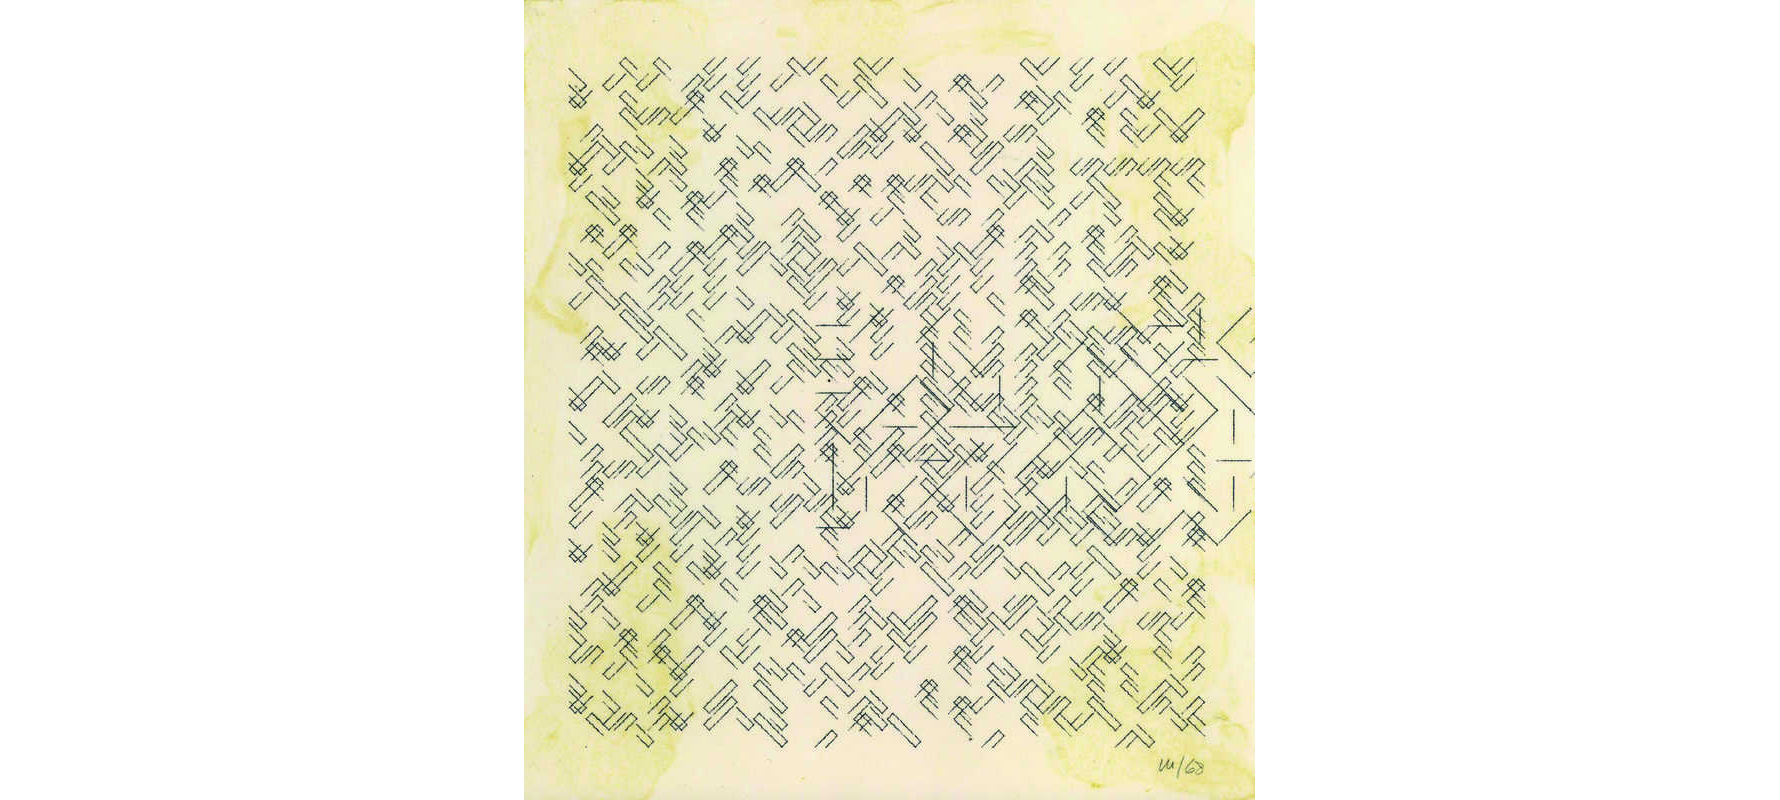
— Vera Molnár, No Title, 1968
In this post, I’ll try to explain some of my workflow when developing new pen plotter prints, and show some of the tools I’ve been building to help organize my process.
Development Environment #
So far, all of my work with the AxiDraw has been with JavaScript and an experimental tool I’ve been building, aptly named penplot. The tool primarily acts as a development environment, making it easier to organize and develop new prints with minimal configuration.
💡 This tool has recently evolved into a more mature framework called canvas-sketch.
You can try the tool out yourself with node@8.4.x and npm@5.3.x or higher.
# install the CLI app globally
npm install penplot -g

# run it, generating a new file and opening the browser
penplot test-print.js --write --open
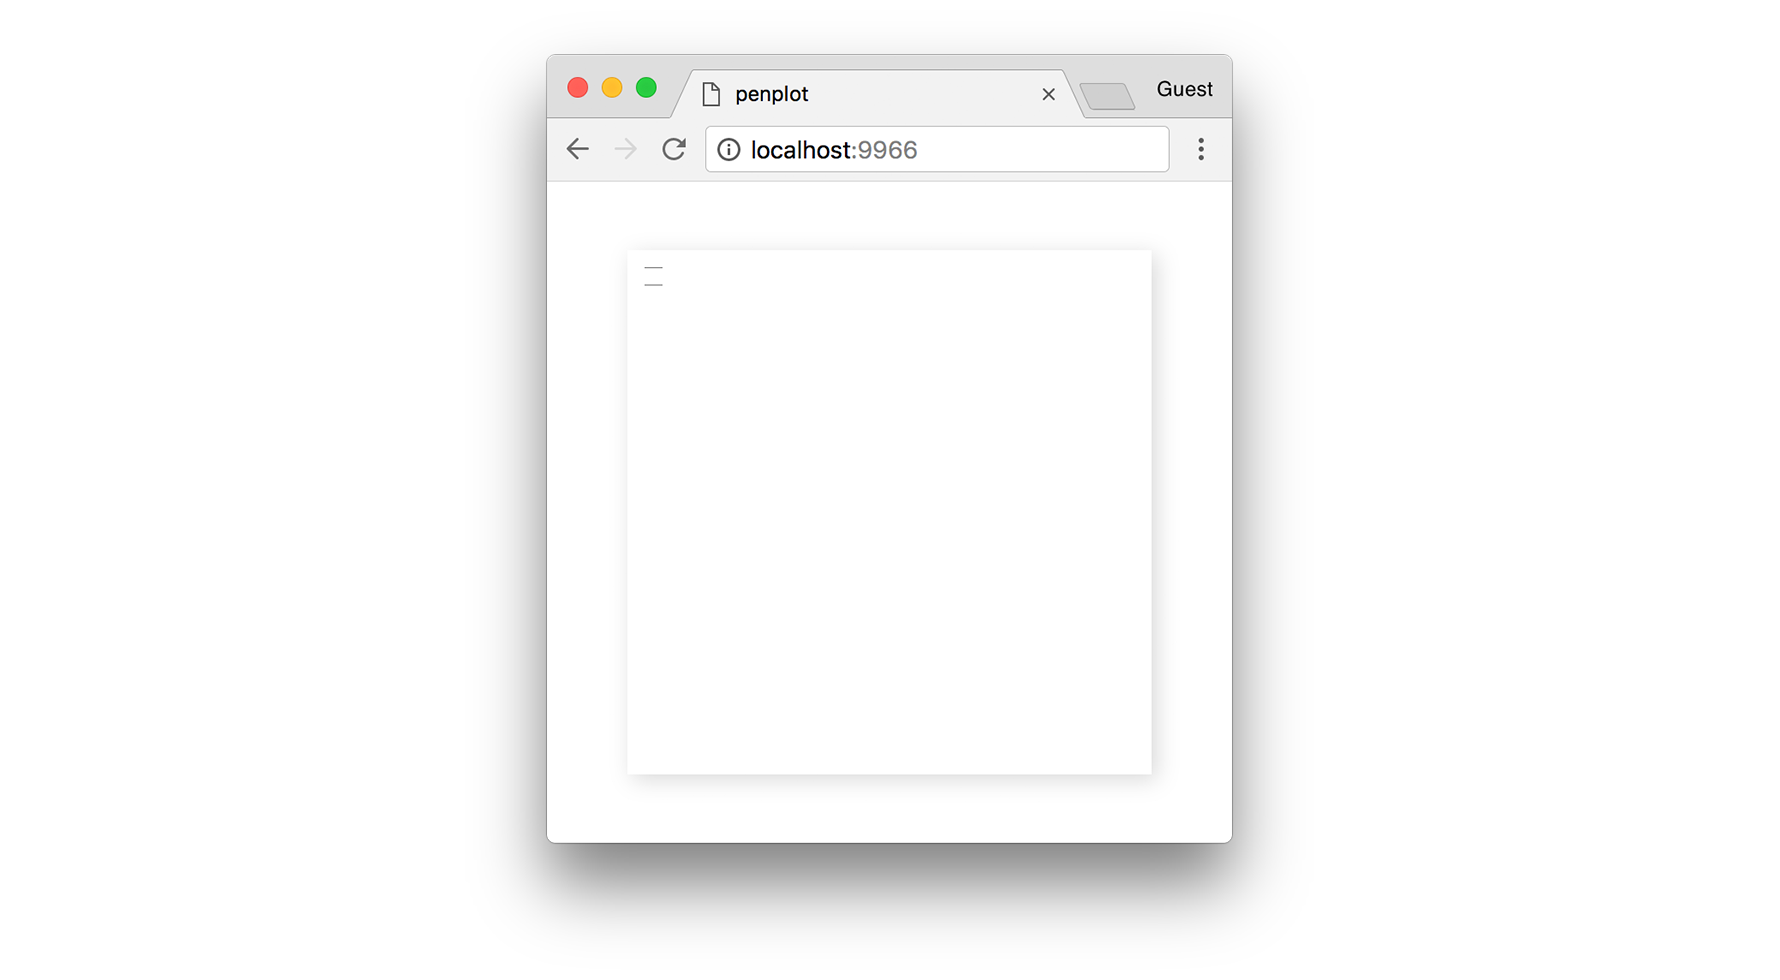
The --write flag will generate a new test-print.js file and --open will launch your browser to localhost:9966. It starts you off with a basic print:
✏️ See here to see the generated source code of this print.
The generated test-print.js file is ready to go; you can edit the ES2015 code to see changes reflected in your browser. When you are happy, hit Cmd + S (save PNG) or Cmd + P (save SVG) to export your print from the browser — the files will save to your Downloads folder.
Geometry & Primitives #
For algorithmic work with AxiDraw and its SVG plugin, I tend to distill all my visuals into a series of polylines composed of nested arrays.
const lines = [
  [
    [ 1, 1 ], [ 2, 1 ]
  ],
  [
    [ 1, 2 ], [ 2, 2 ]
  ]
]
This creates two horizontal lines in the top left of our print, each 1 cm wide. Here, points are defined by [ x, y ] and a polyline (i.e. path) is defined by the points [ a, b, c, d, .... ]. Our list of polylines is defined as [ A, B, ... ], allowing us to create multiple disconnected segments (i.e. where the pen lifts to create a new line).
📐 Penplot scales the Canvas2D context before drawing, so all of your units should be in centimeters.
So far, the code above doesn’t feel very intuitive, but you will hardly ever hardcode coordinates like this. Instead, you should try to think in geometric primitives: points, squares, lines, circles, triangles, etc. For example, to draw some squares in the centre of the print:
// Function to create a square
const square = (x, y, size) => {
  // Define rectangle vertices
  const path = [
    [ x - size, y - size ],
    [ x + size, y - size ],
    [ x + size, y + size ],
    [ x - size, y + size ]
  ];
  // Close the path
  path.push(path[0]);
  return path;
};

// Get centre of the print
const cx = width / 2;
const cy = height / 2;

// Create 12 concentric pairs of squares
const lines = [];
for (let i = 0; i < 12; i++) {
  const size = i + 1;
  const margin = 0.25;
  lines.push(square(cx, cy, size));
  lines.push(square(cx, cy, size + margin));
}
Once the lines are in place, they are easy to render to the Canvas2D context with beginPath() and stroke(), or save to an SVG with the penplot utility, polylinesToSVG().
The result of our code looks like this:
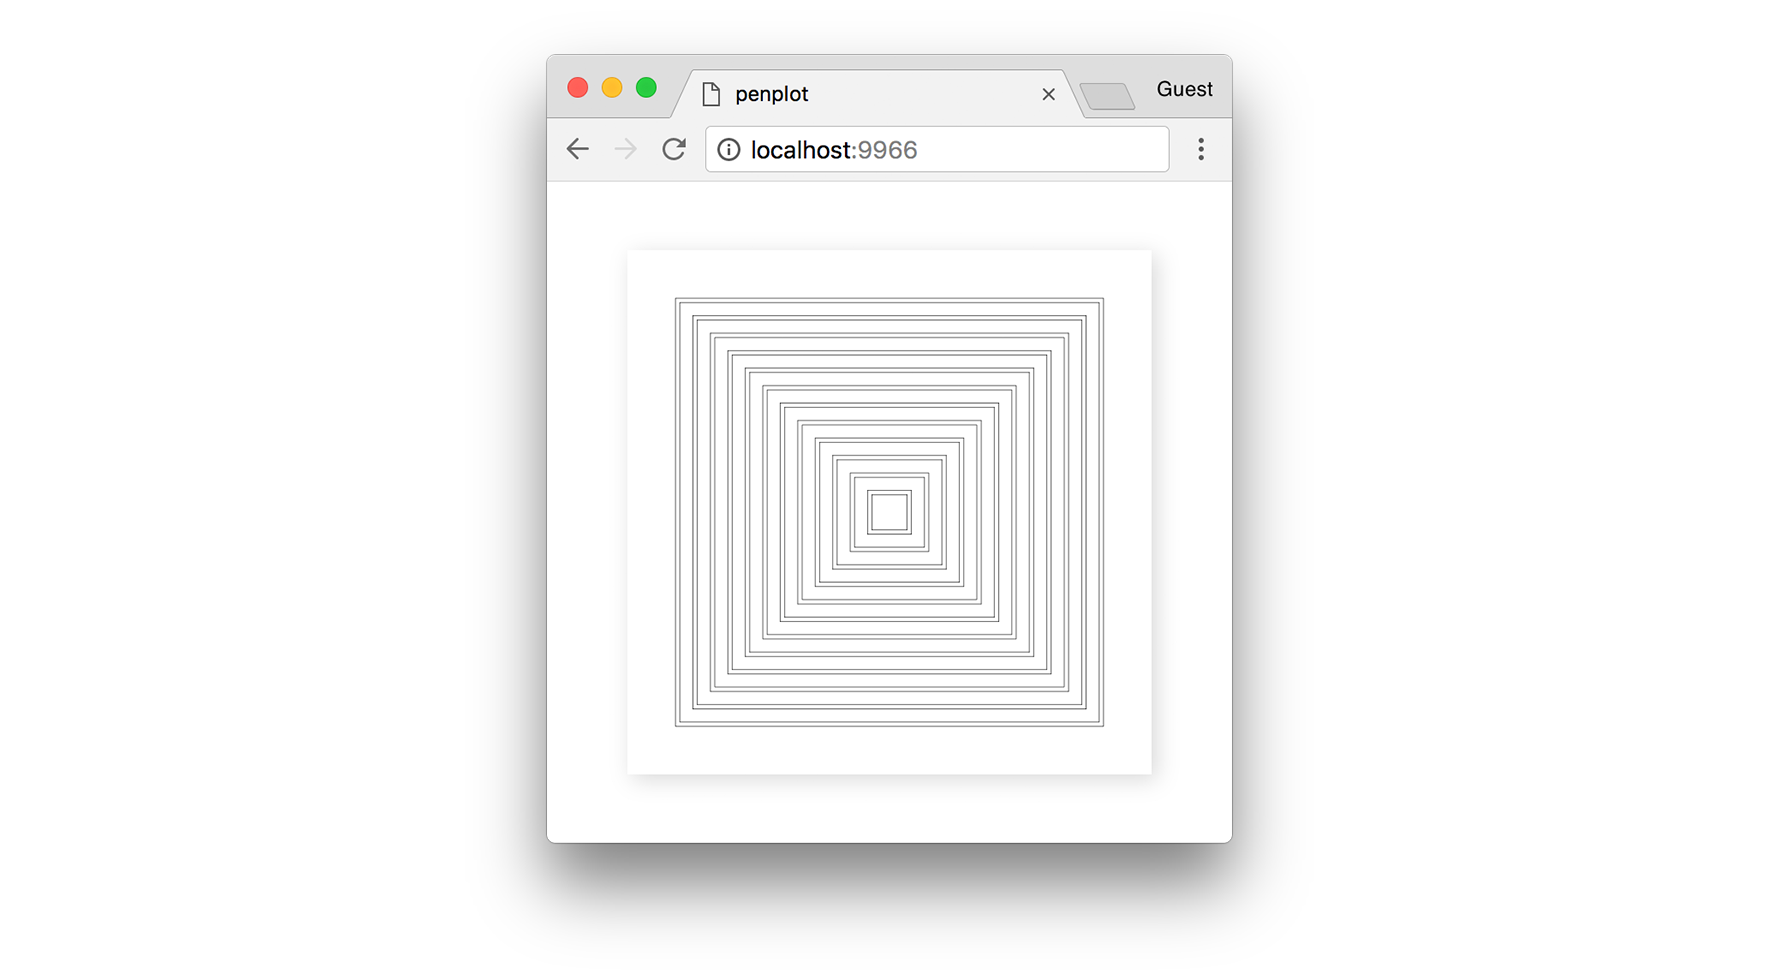
✏️ See here for the final source code of this print.
This is starting to get a bit more interesting, but you may be wondering why not just reproduce this by hand in Illustrator. So, let’s see if we can create something more complex in code.
Delaunay Triangulation #
A simple starting task would be to explore Delaunay triangulation. For this, we will use delaunay-triangulate, a robust triangulation library by Mikola Lysenko that works in 2D and 3D. We will also use the new-array module, a simple array creation utility.
Before we begin, you’ll need to install these dependencies locally:
# first ensure you have a package.json in your folder
npm init -y

# now you can install the required dependencies
npm install delaunay-triangulate new-array
In our JavaScript code, let’s import some of our modules and define a set of 2D points randomly distributed across the print, inset by a small margin.
We use the built-in penplot random library here, which has the function randomFloat(min, max) for convenience.
import newArray from 'new-array';
import { randomFloat } from 'penplot/util/random';

// ...

const pointCount = 200;
const positions = newArray(pointCount).map(() => {
  // Margin from print edge in centimeters
  const margin = 2;
  // Return a random 2D point inset by this margin
  return [
    randomFloat(margin, width - margin),
    randomFloat(margin, height - margin)
  ];
});
💡 I often use
new-arrayandmapto create a list of objects, as I find it more modular and functional than a for loop.
If we were to visualize our points as circles, it might look like this:
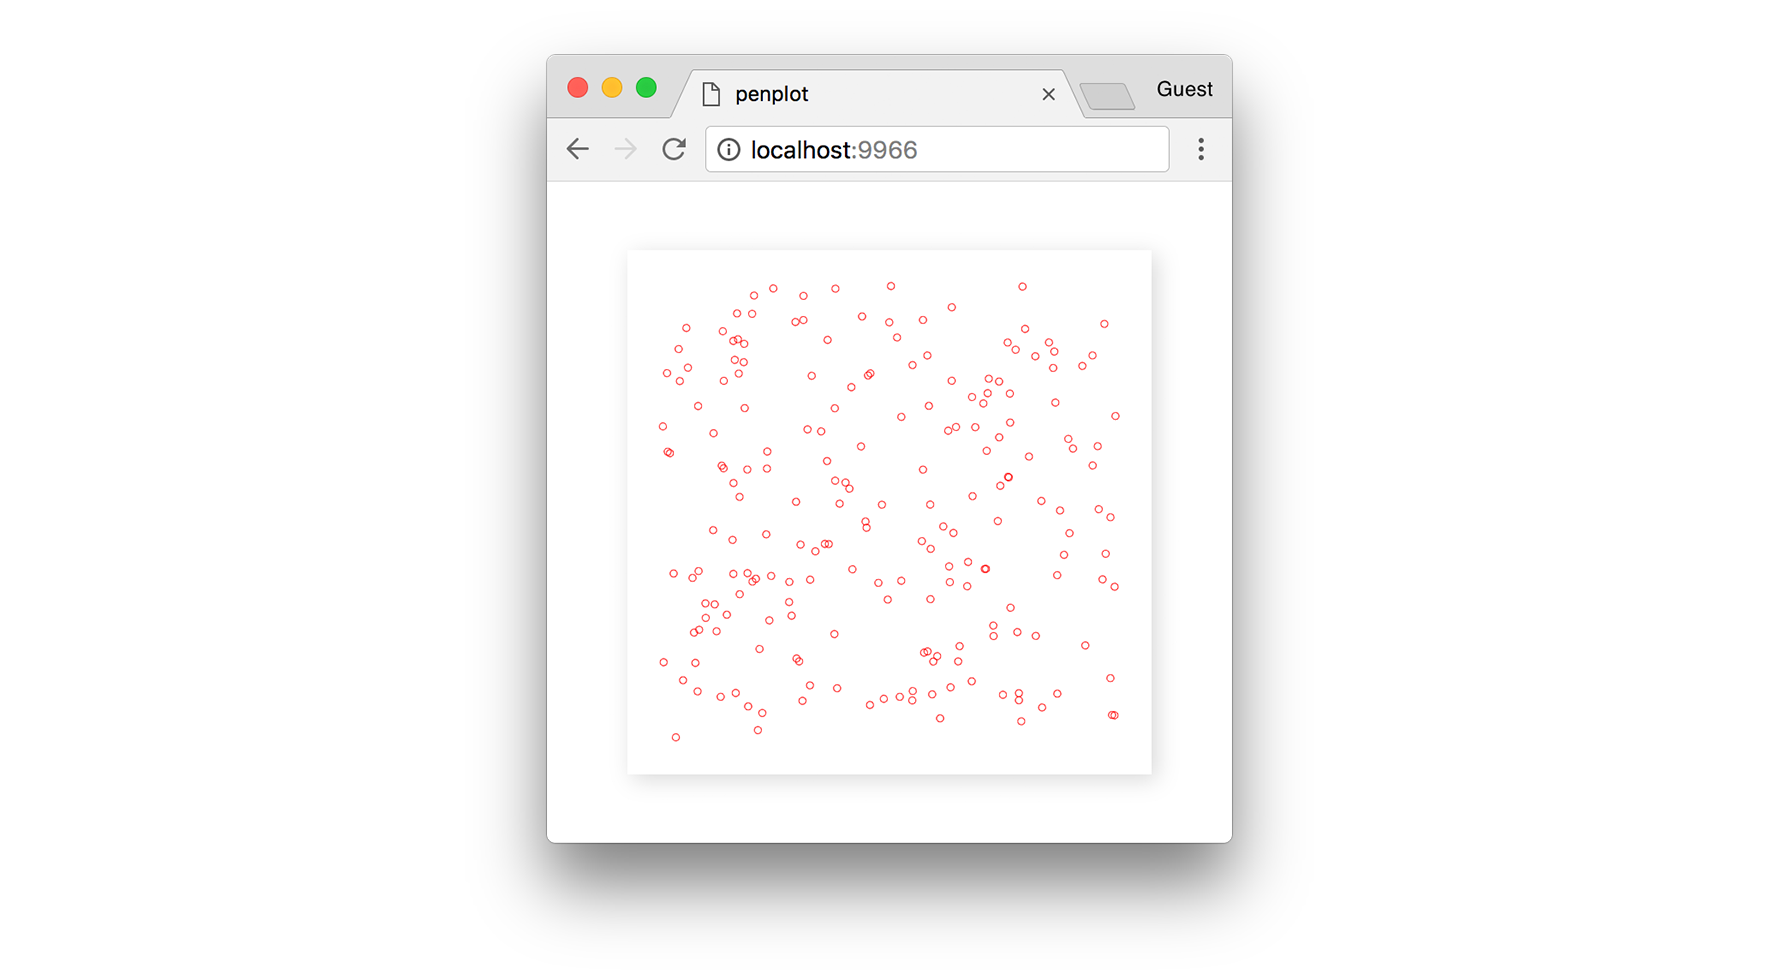
The next step is to triangulate these points, i.e. turn them into triangles. Simply feed the array of points into the triangulate function and it returns a list of “cells.”
import triangulate from 'delaunay-triangulate';

// ...

const cells = triangulate(positions);
The return value is an array of triangles, but instead of giving us the 2D positions of each vertex in the triangle, it gives us the index into the positions array that we passed in.
[
  [ 0, 1, 2 ],
  [ 2, 3, 4 ],
  ...
]
For example, to get the 3 vertices of the first triangle:
const triangle = cells[0].map(i => positions[i]);

// log each 2D point in the triangle
console.log(triangle[0], triangle[1], triangle[2]);
For our final print, we want to map each triangle to a polyline that the pen plotter can draw out.
const lines = cells.map(cell => {
  // Get vertices for this cell
  const triangle = cell.map(i => positions[i]);
  // Close the path
  triangle.push(triangle[0]);
  return triangle;
});
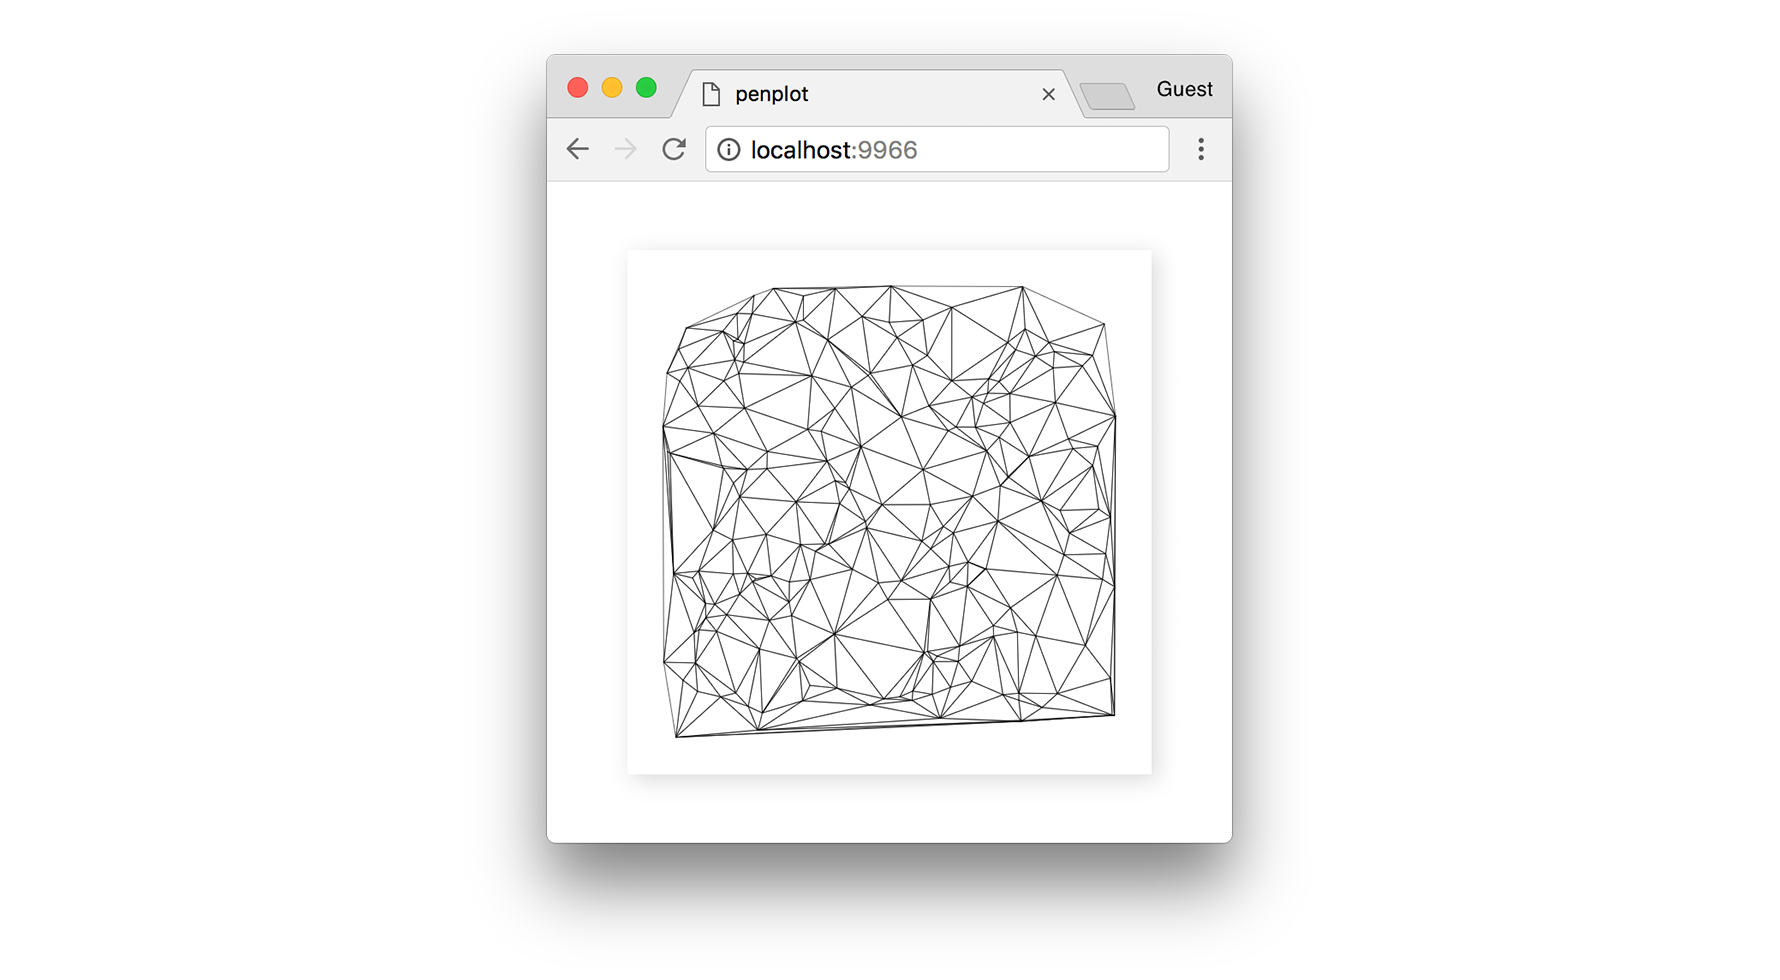
Now we have all the lines we need to send the SVG to AxiDraw. In the browser, hit Cmd + S and Cmd + P to save a PNG and SVG file, respectively, into your Downloads folder.
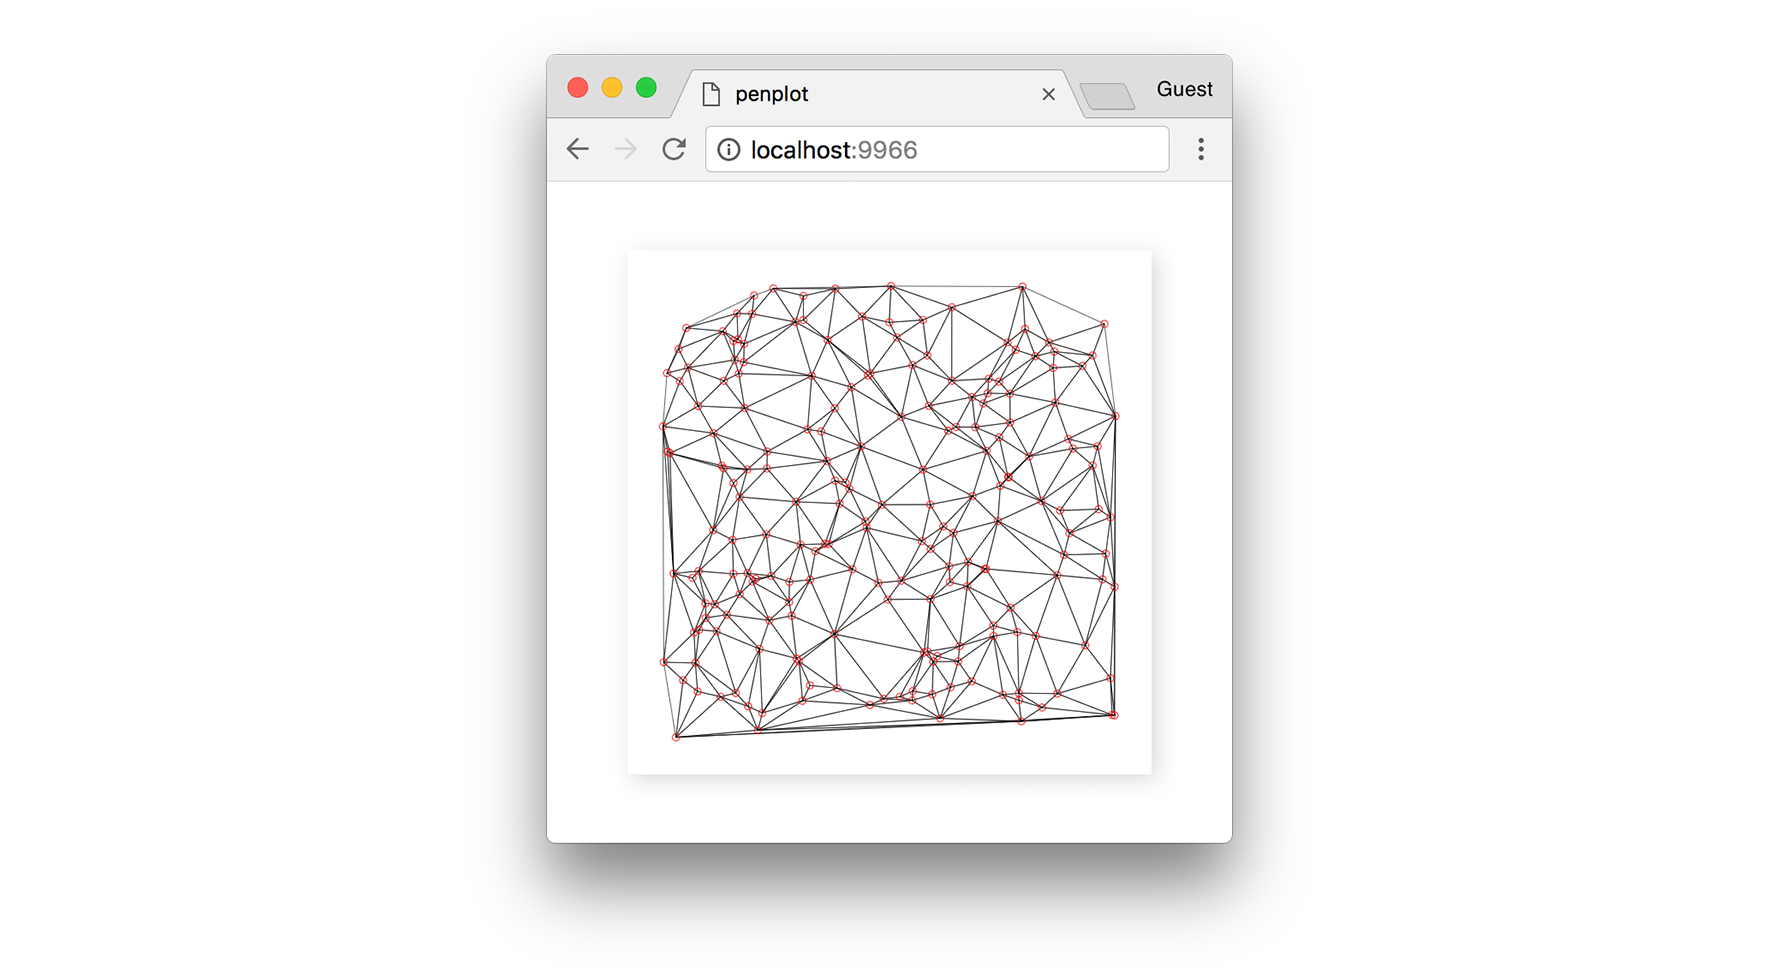
For reference, below you can see how our original random points have now become the vertices for each triangle:
💡 The
randommodule includes asetSeed(n)function, which is useful if you want predictable randomness every time the page reloads.
If we increase the pointCount to a higher value, we start to get a more well-defined edge, and potentially a more interesting print.
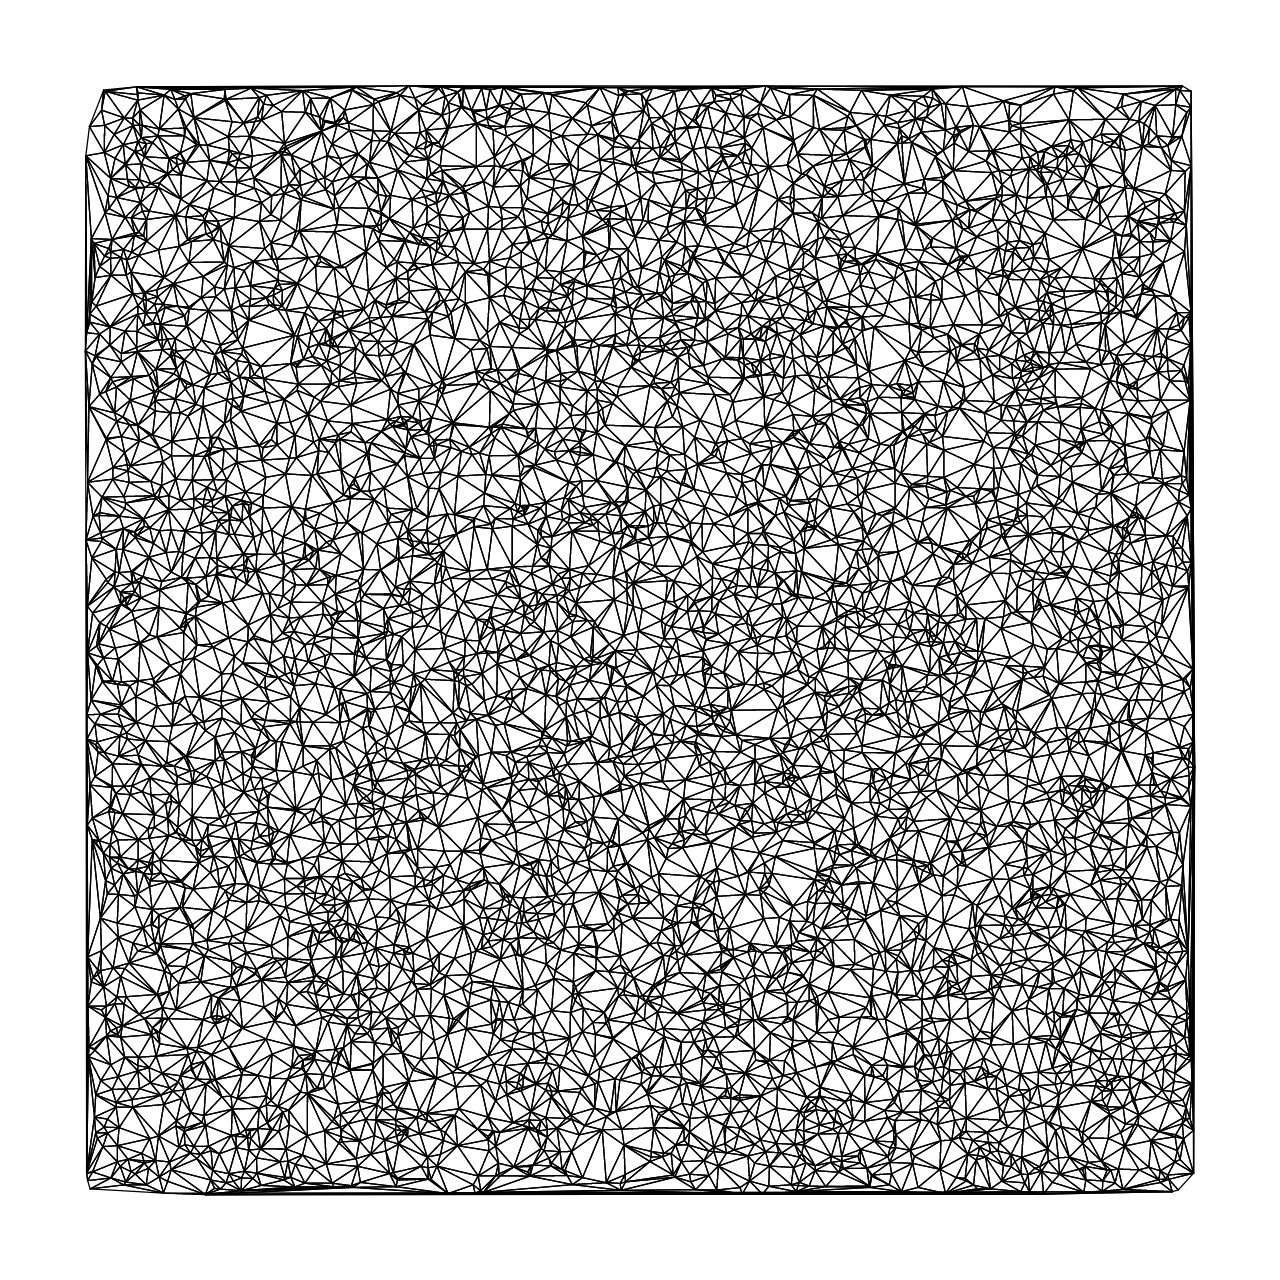
✏️ See here for the final source code of this print.
Part Two #
In the next instalment of this series, we’ll attempt to reproduce a fracturing algorithm for a more interesting composition.
Continue reading: Pen Plotter Art & Algorithms, Part 2